Looking Back at My Losing Gold Trades
Trading Journal · About 2 min read
Over seven months I ran a paper-trading account across gold, crude oil, Nasdaq futures, and other instruments. I eventually scaled back because my sizing was inconsistent and I often entered without a clear thesis. Then I exported the order history to see what I could learn from the results.
All trades and dollar amounts in this post are simulated. No real capital was at risk in this account.
Reconstructing the account
The original analysis script is not included here, so the trade-pairing calculation and reported totals cannot yet be independently reproduced from this page.
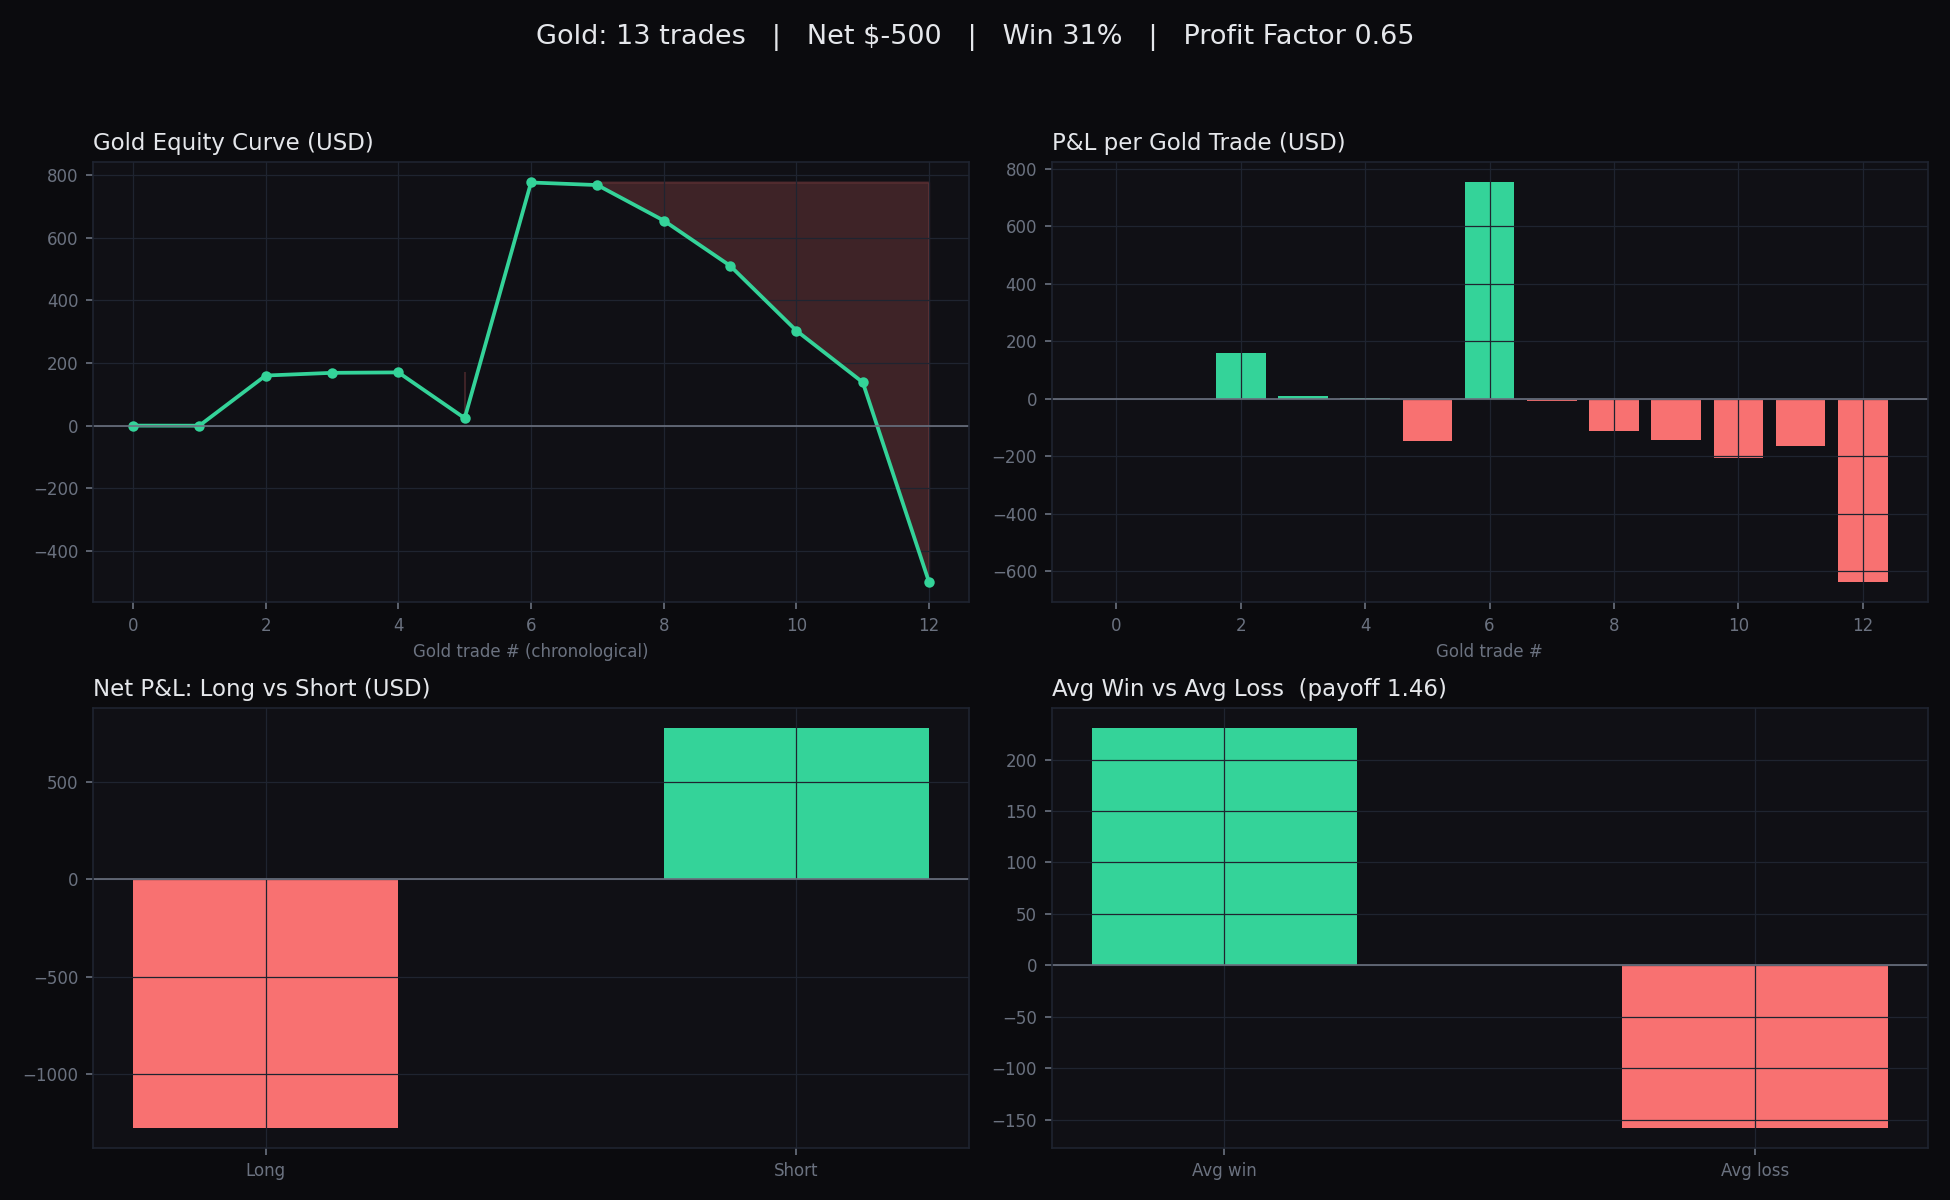
The Python analysis paired entries with exits and calculated profit and loss, then focused on gold, the instrument I had traded most. Across 13 completed trades, the account lost roughly $500. The win rate was 31%, and the profit factor, gross profits divided by gross losses, was 0.65.
The average result was about negative $38 per trade. That describes these trades; it is too little evidence to estimate what a repeatable strategy would earn over time.
Where the losses were
All six long positions lost money, for a combined loss of roughly $1,275. The seven shorts had a 57% win rate and gained about $775. Splitting the results by direction showed something the net loss alone could not: the long trades accounted for the losses, while the shorts offset part of them.
What thirteen trades cannot tell me
It is tempting to turn that split into a rule: I should stop going long gold. But six trades cannot establish that I have a persistent directional weakness. The outcome could reflect the market conditions, entry timing, sizing, chance, or a combination. I have not separated those explanations.
The breakdown tells me where to look. It does not yet tell me why those trades lost. To investigate that, I would need to compare the setups, position sizes, and conditions around each entry, rather than infer the cause from the final profit and loss.
What I take from the audit
I had already felt that my process was inconsistent. Reconstructing the account gave me specific decisions to revisit. I could also see how spreading a small number of trades across many instruments limited what I could learn about any one of them.
Stepping back was useful. So was doing this with a simulated account at sixteen. The unresolved question is which parts of my decision-making produced these results, and which parts were noise. The chart helps me ask that question more precisely.